
A Dashboard will give you, in a glimpse, and overview of your metrics, in a simple graphical interface.
What is a Dashboard in Excel?
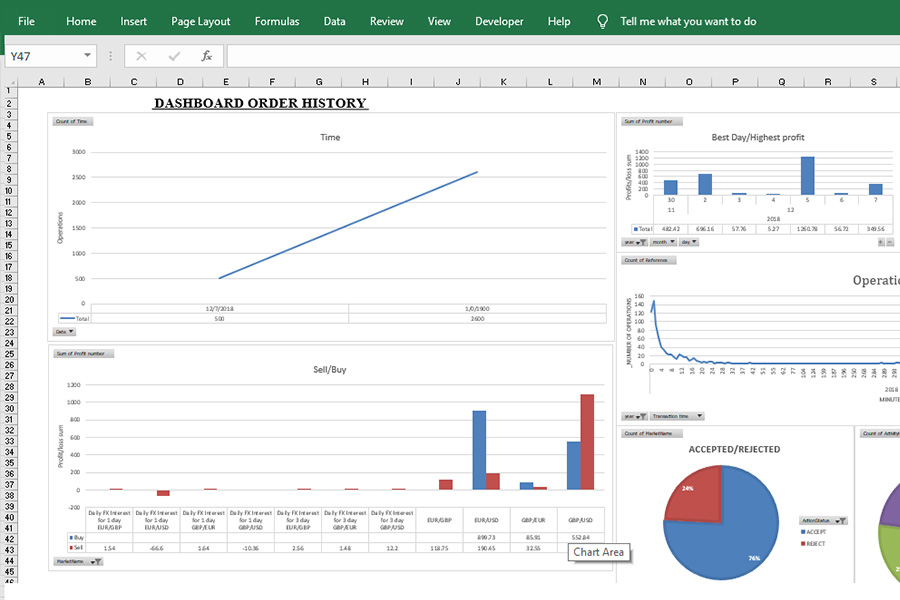
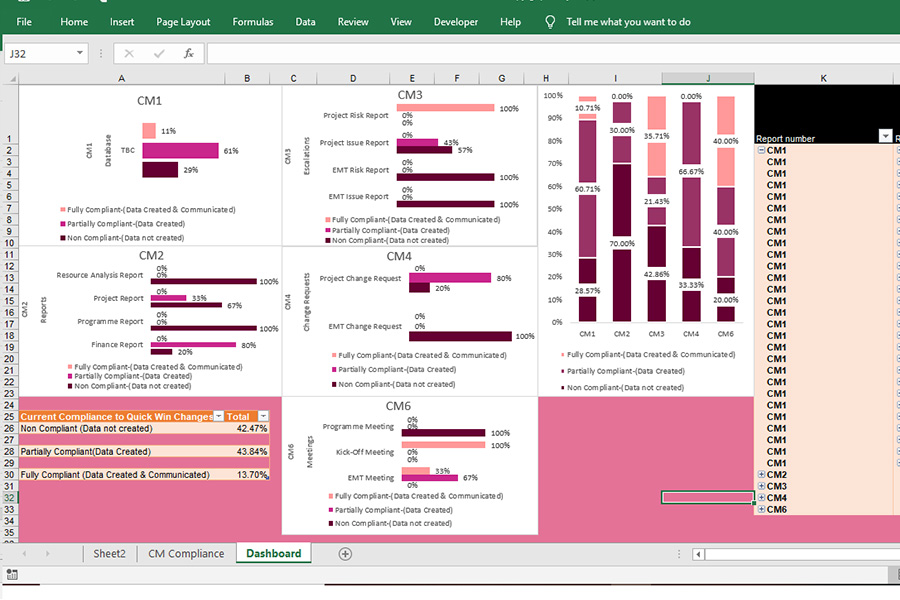
Dashboards track KPIs, metrics, and other data points in one visual, central sheet. They give you a high-level view of work, helping you make quick decisions and keeping everyone up to date. A dashboard’s visual nature simplifies complex data and provides an at-a-glance view of current status or performance in real time.
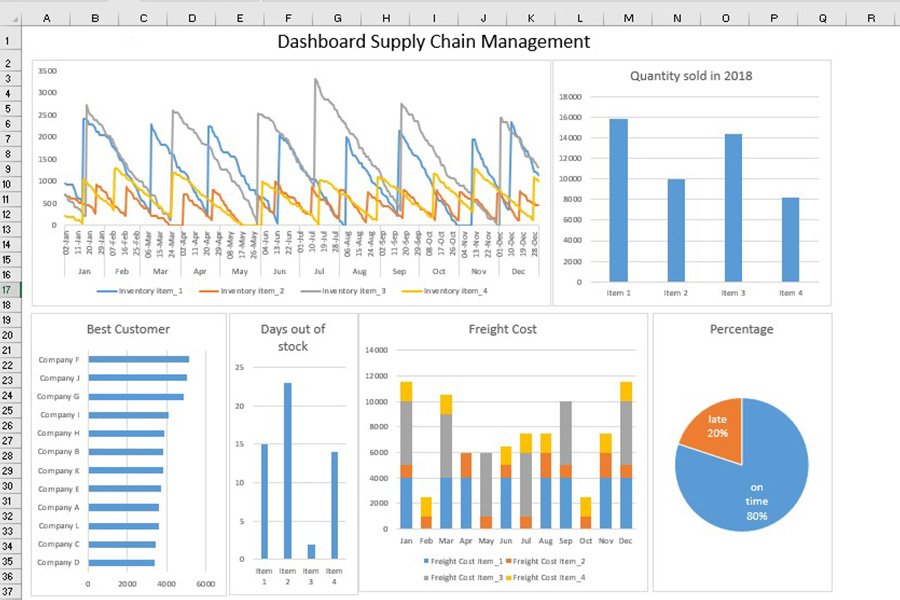
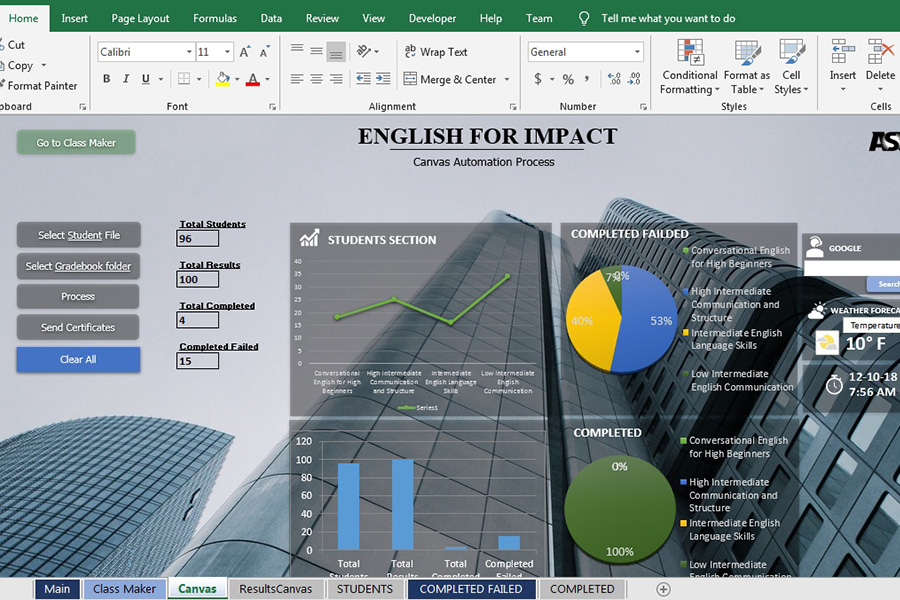
Dashboards are made up of tables, charts, gauges, and numbers. They can be used in any industry, for almost any purpose. For example, you could make a project dashboard, financial dashboard, marketing dashboard, and more.
Before you start building your dashboard, first take some time to reflect on why you need a dashboard, what purpose it will serve, where the data will come from, and what capabilities you do and don’t need.
It might also be helpful to mockup your Excel dashboard on a piece of paper. Draw boxes for each data type to get a sense of the layout and add quick sketches of the type of graphs you want to include. This mockup will help get everyone on the same page and let you get approval from stakeholders before you start spending time and money on the actual dashboard.